


HOME|Ideas and resoueces for planetary science experiments|The Effect of Light Pollution
宇宙の実験教室
Ideas and resoueces for planetary science experiments
カテゴリ
Category
- 実験教室Idea and Resources for Space science experiments
- 対象項目別Category: Contents
- 学年単元別Category: Study Age
-
- 実践授業Activity Reports
タグ
Tag
 星空から光害を考えよう
ねらい
自分たちが住んでいる地域の星の見えやすさ(星空環境)を調べましょう。
「星空環境調査」とは、ある特定の地域の東西南北天頂の5方角において調査器具を用いて星の数を数え、星空の環境を調査するものです。夜空が外灯やネオンなどの光の影響を受けているほど、明るい等級の星しか見えないことを利用します。
この教材では、牛乳パックを使ってつくる調査器具を用いて夜空を眺め,視野内に見える星の数を調べます。 その結果から観察地点で見える星の等級を知り,観察地域における星の見えやすさ(星空環境)について考えます。
調査器具のつくりかた
夜でも星の見えない場所がある!?
街の外灯やネオンによって、明るくなってしまった夜空では星が見えにくくなってしまいます。あなたの住んでいるまちの星空環境はどうでしょう?星の観察に適した場所はどこでしょう?
簡単に作れる調査器具を使って、星空環境を調べてみましょう。
用意するもの
1リットルの紙パック(牛乳パックなど)、100mm製本テープ2本、ハサミ、コンパス
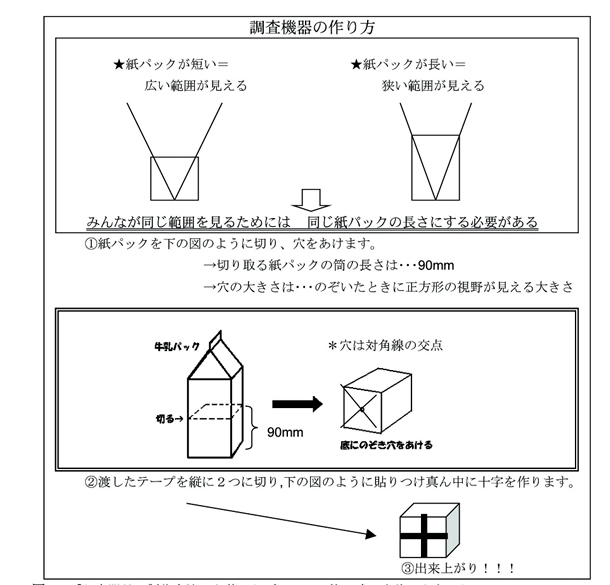
調査器具の視野角と筒の長さの関係を示した表
| 視野角(°) | 筒の長さ(mm) |
| 20 | 195 |
| 30 | 126 |
| 40 | 90 |
| 50 | 66 |
調査方法
準備
記録用紙 筆記用具 調査器具 星図 懐中電灯 時計
記録用紙は、調査日・調査時間・観察地点・東-西-南-北-天頂の5方向について見えた星の数と雲の量について 記入できるようなものをあらかじめ作成しておきます。
記録用紙の例 PDFファイル 星図は観察する日に合わせたものを準備します。星図はアストロアーツ社のホームページにある星座早見盤などを利用すると便利です。
アストロアーツ社ホームページ http://www.astroarts.co.jp/
観察する日に合わせた星図を入手したら,東-西-南-北-天頂の5方向それぞれについて基準星を決めて印を付けておきます。
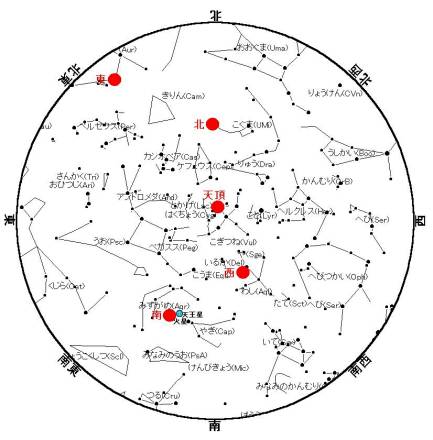
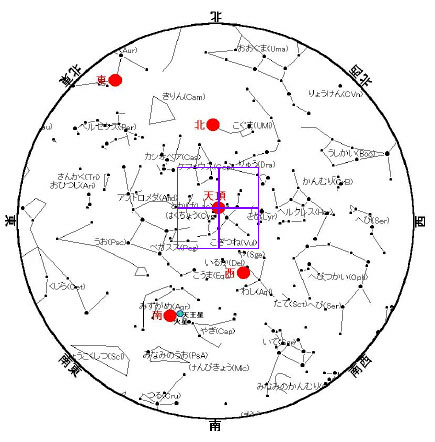
基準星を示した図 [2003.10.15/20:00の星空]
●で示された星をそれぞれの方角で視野中心とする。北●北極星 東●カペラ 南●火星 西●アルタイル 天頂●デネブ。
観察
比べたいいくつかの地点で以下のことをします。
- 観察地点に行ってから10分間くらいは暗やみに目を慣れさせるために夜空を見上げます。
- 観察地点での東西南北の方位を確認し,観察する方向へ体を向けます。
- 星図を見て観察する方向の基準星●を見つけます。
- この見つけた星が牛乳パックで作った調査器具の中心に来るようにのぞきます。
牛乳パックの中心を天頂の基準星に合わせたところ
- さて,牛乳パックの中に星はいくつあるでしょうか?雲がどのくらいあったか,なかったかも観察して記録用紙に記入します。
- 3~5を東・西・南・北・天頂それぞれの方角で行います。
結果集計方法
変換表の作成
各方角によってもともとの星の数が異なるので、見える星の数が多いほど星空環境がよいとは言えません。 そこで、「視野数の星数」を「何等級まで見えているか」に変換するため、各方角において等級ごとの星数を想定し、変換表を作ります。
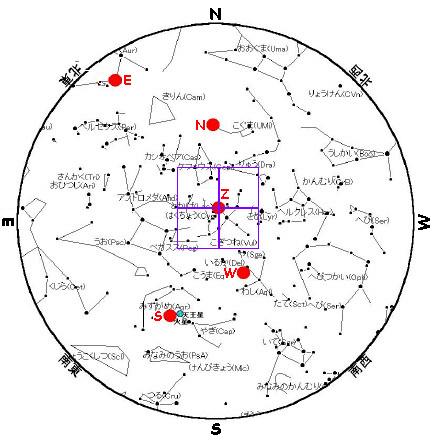
例えば、デネブ(下の図の●)を基準星とする視野40°の天頂の星空を表す図から等級ごとに見えるであろう星の数を数えて変換表を作ると下のようになります。
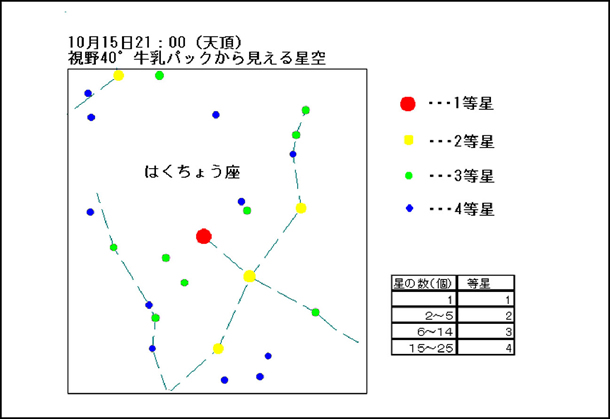
すると、例えば天頂で4コ星が見えたのなら、2等級まで見えている---と考えます。
このような表を各方角について作ります。 これらの表を使って、調査結果の星の数から「どの地点のどの方角で何等級までの星が見えたのか」がわかります。
考えよう
あなたの街の星空環境はどうでしたか? 各観察地点に違いは見られましたか?
予想と合っていたでしょうか?
集計結果を用いて星空環境マップを作ってみましょう。
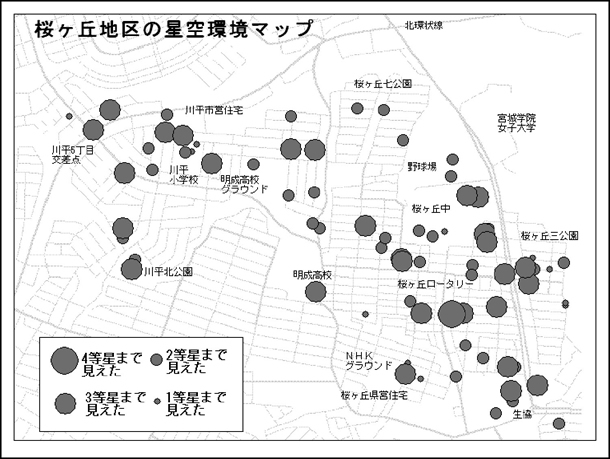
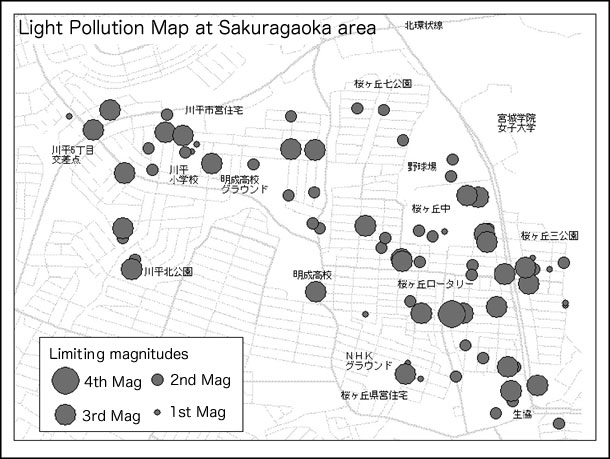
星空環境マップの作成例
星空環境マップの作成
調査結果をまとめて地図にプロットします。 各観察地点について何等級まで見えたのか、「4等級まで見えた」「3等級まで見えた」「2等級まで見えた」「1等級まで見えた」とそれぞれ印を変えて地図に入れていきましょう。
こうすることで調査結果が目に見えてわかりやすくなります。 調査前にした予想と比べてみましょう。予想は当たっていましたか? 予想と違う結果が出ていたら,それはなぜかを考えてみましょう。
星空環境マップの例
関連項目
The Effect of Light Pollution
Introduction
Find out how easily the stars are visible in your local area
In so-called "night sky environmental research", a special investigation instrument is used to count the number of stars visible in a specified area looking north, south, east, west and overhead. The extent to which the night sky is affected by light from streetlights, outdoor lamps etc. is determined by the brightness of the faintest stars visible.
In this teaching aid, you will watch the night sky using an investigation instrument made from a milk carton, and count the number of stars which are visible inside its field of view.
The results will tell you the faintest stars visible from a given location, and this will enable you to think about how the visibility of the night sky is affected by light pollution.
Measuring Instrument Construction
Are there places where the stars aren't even visible at night?!
Depending on the brightness of streetlights and outdoor lights, the night sky becomes brighter, making the stars more difficult to see. What is the night sky environment like in your local area? What location will be best for observing the stars?
Using an easily-made instrument, determine the night sky environment.
Things to Prepare
1-litre carton (milk carton or similar), 2x 100mm lengths of bookbinding tape, scissors, compass
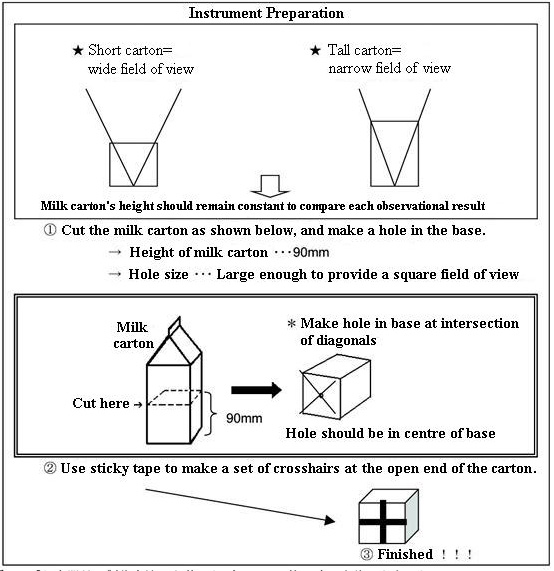
Table below shows the relationship between Angle of visibility of the investigation instrument and tube length.
| Angle of Visibility (°) |
Tube length (mm) |
| 20 | 195 |
| 30 | 126 |
| 40 | 90 |
| 50 | 66 |
Method of Examination
Preparation
Record paper; Writing materials; Investigation instrument; Star Atlas; Flashlight; Clock
Before going out to observe, write headings on the record paper for the five observing directions (north, south, east, west and overhead), ready to note the number of stars visible in each, together with the observing site and the date and time.
PDF File
Prepare a star atlas for the observing date and time. An atlas showing the constellation outlines, such as that produced by the Astroarts Corporation, is suitable for this purpose.
Astroarts Corporation Homepage: http://www.astroarts.co.jp/
When you have prepared a star chart for your observing data and time, label it with each of the five directions you will be observing.
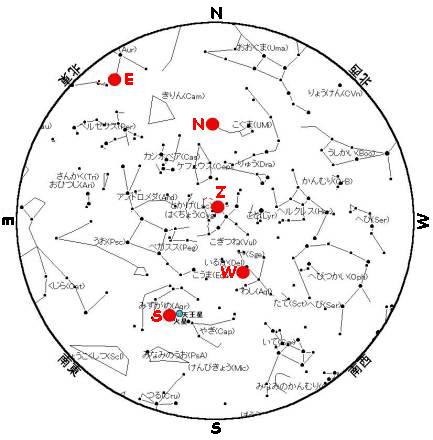
The figure shows standard stars [Night sky on 2003.10.15/20:00]
●The stars labelled like this represent the centre of the observer's field of view for each observing direction: North●Polaris; East●Capella; South●Mars; West●Altair; Zenith●Deneb.
Observing
Thing below is done with several positions which we would like to compare.
- After going to the observing site, look at the night sky for about 10 minutes to allow your eyes to become dark adapted to the darkness.
- Having determined the direction of north from the observing site, the observer faces in the required observing direction.
- From the star map, the standard star in a given observing direction is identified with ● this symbol.
- When the investigation instrument made from a milk carton is centred on a given observing direction, the standard star will be obscured by the central crosshairs.
- How many stars will be visible within the milk carton? Note this number on the record paper, together with details of any cloud cover.
- Repeat the 3~5 process for each of the observing directions
Milk carton aligned with zenith observing direction.
Determination of Result
Compilation in Conversion Table
Because the number of stars theoretically visible in a given region varies across the sky, it is important to study the night sky conditions in a region where there is a very large number of stars. Next, we need to translate the number of stars visible in a given field into the faintest stars visible, which is done using a conversion table.
For example, with the map below we would count the number of stars visible within 40° of Deneb (labelled ●) and then use the conversion table to find the faintest star visible on a given evening.
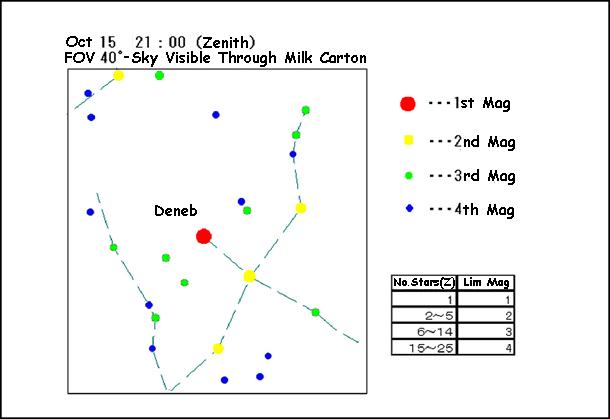
So, if you observe 4 stars in the zenith region, is the limiting magnitude 2? Think about this.
Prepare a chart like this for each observing direction.
With these charts, knowing the number of stars visible in a given region of the sky, it is possible to determine brightness of the faintest star visible ("limiting magnitude").
Discussion
What was the condition of the night sky in your home town?
Did it vary with observing direction?
How did this compare with your expectations?
Using these results, we can now try to construct a night sky light pollution map.
Sample Light Pollution Chart
Compilation of Light Pollution Map
This collates your observations, and plots them on a map.
Data from each of the observing sites, i.e. "limiting magnitudes" of 1, 2, 3 or 4, are represented by different symbols, which are plotted on the map.
When the data is plotted in this way, it is easy to see how the night sky conditions vary with location.
Try to compare the results with your prior expectations. Do they agree?
If the results are different from expectations, think about why this might be.
Example of Light Pollution Chart
Dark Sky Meter Project / ITO, Yoshiharu
Dark Sky Meter Project / ITO, Yoshiharu